

What is Quick Look?
Quick Look is a live, read-only view of check-in activity for one event. It refreshes every 30 seconds and shows who has scanned in, how full each area is, how fast gates are moving, and whether any scanner has gone quiet.
The screen only reports; it never changes anything. Entry rules are still enforced at the scanners themselves.
If the event has finished, the page shows an ENDED label and the figures reflect the final state at the close of the event.
Why it matters?
👀 See the door in real time. Know how many people are in and how fast they're arriving without walking the site or calling gate leads.
🚨 Catch problems early. A scanner that goes quiet is flagged within about 2 minutes, so staff can fix it before a queue builds.
🚪 Put staff where they're needed. Hourly totals and scans per minute show which gates are busy and which are idle.
🎟️ Spot no-shows by ticket type. Arrival coverage shows which ticket types are slow to arrive, such as VIP or afterparty.
📺 Keep the whole team informed. TV mode turns the dashboard into a live display for the control room or venue screens.
✅ Trust the numbers. Every figure comes from the same check-in records the scanners write, and warnings appear when a count may be drifting.
Where to find it?
Quick Look Buttons - Explained
Filters
All control maps: pick one control map to focus on.
All control areas: narrow to a single area. This changes the per-area sections (occupancy, throughput, gates). The five headline figures stay event-wide, so the totals always match.
All days: for multi-day events, pick a single schedule day. Days follow the event's own time zone, not the time zone of your computer.
The Updated … ago note beside the filters shows when the figures last refreshed.

TV mode
TV mode puts the dashboard on a venue screen. Click TV mode under the page title and the page fills the whole screen with everything shown larger, the controls hidden, and no scrolling needed.
The figures keep refreshing every 30 seconds while TV mode is on. If there are more areas than fit across the screen, the occupancy strip scrolls by itself. Press Esc to leave TV mode.
Individual sections also have a small TV button in their top-right corner, for hiding/showing that section when on TV Mode.
Headline Figures
Five tiles across the top give the event-wide picture. They always cover the whole event, even when you filter to one area.
The graph under shows the trend over time. It is there to show direction only; the big number is the figure to rely on.
Scanned In - Every entry scan recorded, plus how many came in during the last hour. A person scanned twice counts twice.
Inside now / Inside at Close - How many different ticket holders are inside right now. After the event ends, it shows how many were still inside at day end.
Arrival Coverage - Share of valid tickets that have arrived at least once.
Scans per Minute - Current scan rate across all gates, compared with the previous 10 minutes.
Scanners Active - Scanners that reported in the last 10 minutes, out of all scanners.

Occupancy by Control Area
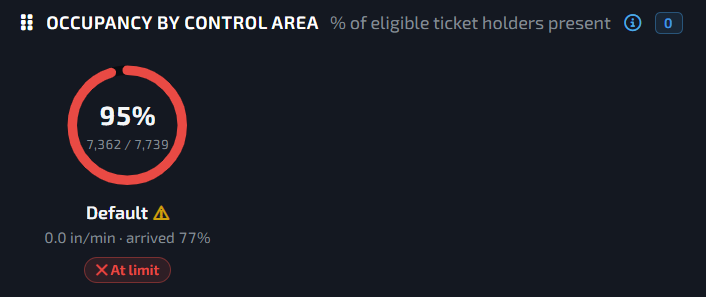
Each area gets a ring showing what share of its eligible ticket holders are inside. For example, 95% with 7,362 / 7,739 means 7,362 of the 7,739 people allowed in that area are present.
This is based on tickets, not on the physical or fire-code capacity of the space. A full ring means most ticket holders are in, not that the room is dangerously crowded.
Things to know:
Areas don't add up. A ticket that is valid in several areas counts in each one, so there is no grand total across areas.
Under each ring: the area name, its current scans per minute, and how many of its ticket holders have arrived.
Status chip: a chip such as High or At limit appears when an area is close to or at its full share of ticket holders.
Warning sign (⚠): shown when exit scanning in that area has gone quiet. The count may be drifting because people are leaving without being scanned out, and the card says so instead of hiding it.
Hourly Totals
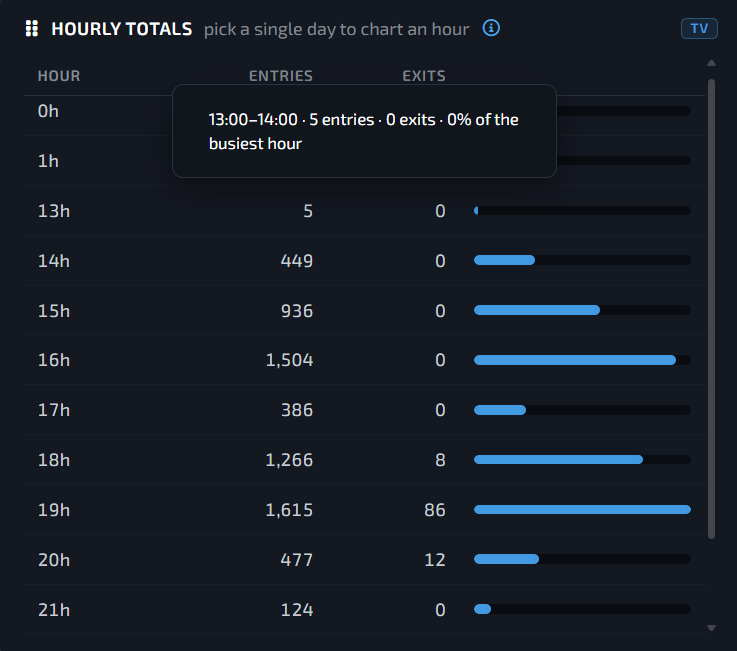
Hourly totals lists entries and exits for each hour of the day, with a bar so busy hours stand out. Pick a single day in the All days filter to see one day's hours.
Throughput Area
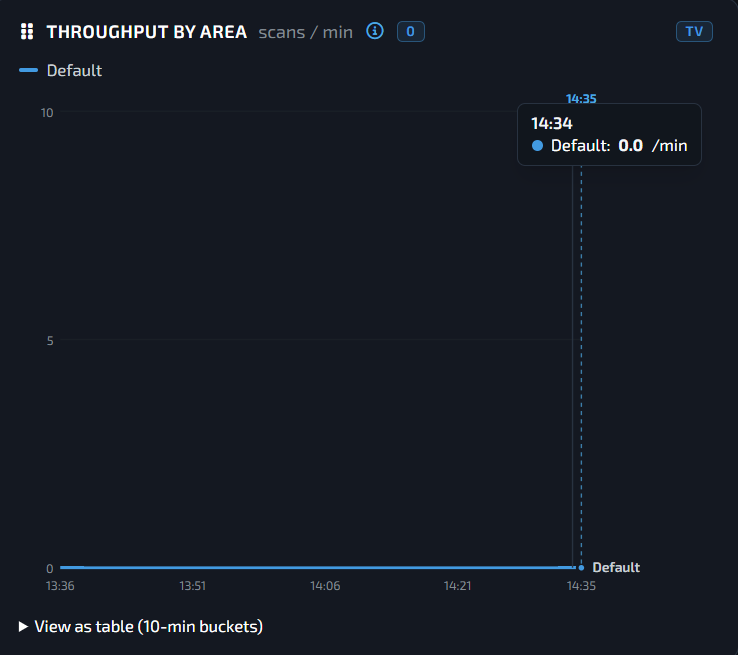
Throughput by area is a line chart of scans per minute for each area over the last hour. The newest minute is at the right edge, marked with the current time. Hover over the chart to see every area's value at a given minute. If you'd rather read numbers, click View as table (10-min buckets) under the chart.
Gates
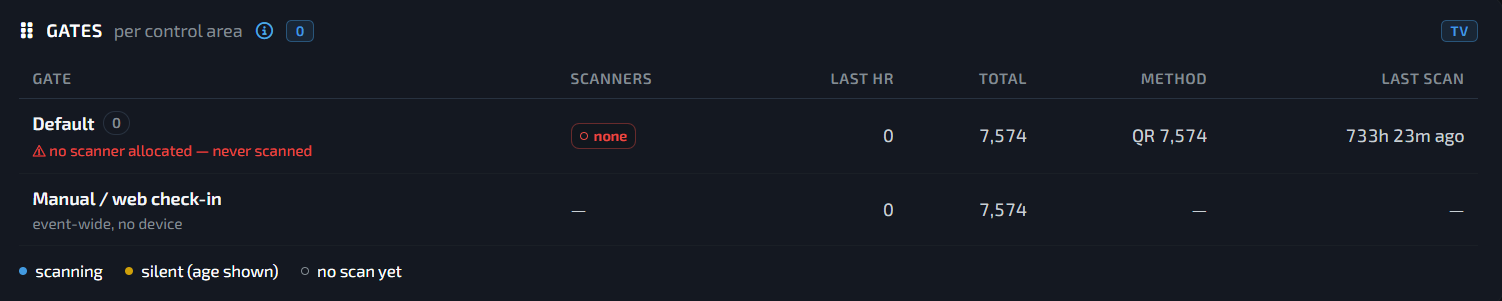
The Gates table has one row per control area, because a gate is an entrance, not a device. A main entrance with six scanners is still one row.
Gate- The area name. A red warning appears under it if a scanner has gone silent or has never scanned
Scanners - A chip for each scanner and its state
Scanner chips use three states: scanning (blue), silent (yellow, with how long it has been quiet), and no scan yet (empty circle). A gate that stops scanning is flagged within about 2 minutes.
Last Hour - Scans in the last hour
Total - All scans at this gate so far
Method - How tickets were scanned, for example QR
Last Scan - How long ago the most recent scan happened
A separate Manual / web check-in row covers check-ins done by hand or on the web, which aren't tied to any scanner.
Arrival by Ticket Type
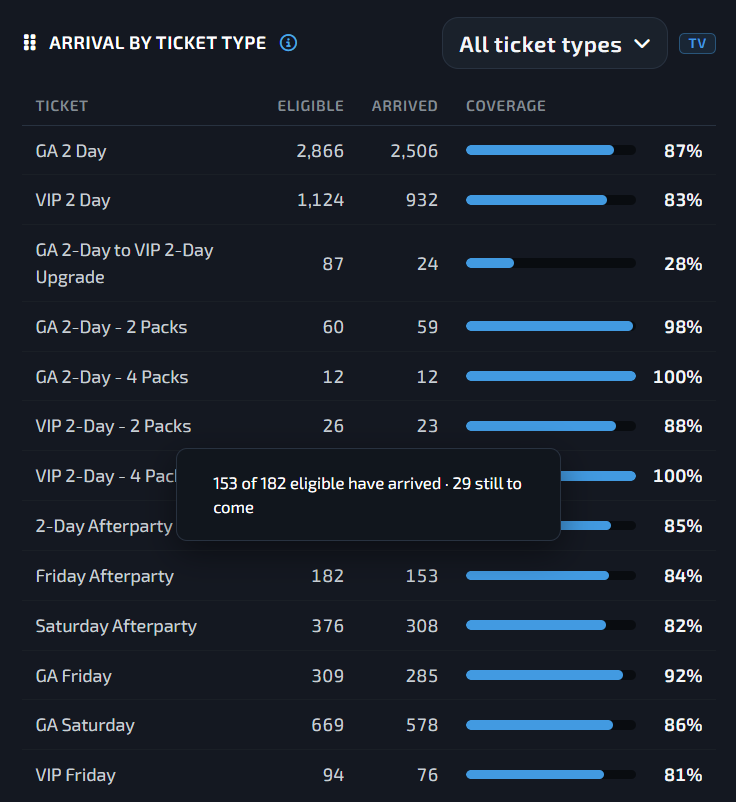
Arrival by ticket type shows, for each ticket type, how many are eligible, how many have arrived, and the coverage as a percentage. For example, GA 2 Day at 2,506 of 2,866 is 87% arrived. Use the All ticket types dropdown to focus on one type.
Ticket types are matched to areas the same way the scanners match them, so these figures line up with what happens at the gate.
Scan Method
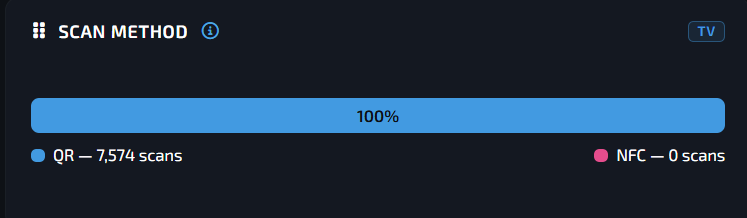
Scan method shows how scans split between QR codes and NFC.
FAQs
Will keeping Quick Look open slow down the scanners at the gate?
No. Quick Look only reads check-ins that scanners already record. It doesn't touch the scanning process.
How can I tell if the screen has stopped updating, for example if the control room loses internet?
Watch the Updated … ago note at the top right. If it keeps climbing past 30 seconds, the page isn't getting fresh data.
The times on the charts don't match my watch. Why?
Quick Look uses the event's time zone. If you're in a different time zone from the venue, the times will look shifted.
A ticket type has much lower arrival than the others. What could that mean?
Those guests may be arriving late or not coming. It's worth checking the ticket type's timing and any messaging sent to those buyers.
The event is over. Can I still use Quick Look for a post-event recap?
Yes. The page keeps showing the final figures. There's no export yet, so take screenshots of the sections you need.
After the event ends, Scanners active shows 0/0. Is something broken?
No. That tile only counts scanners that reported in the last 10 minutes, so it drops to zero once scanning stops.